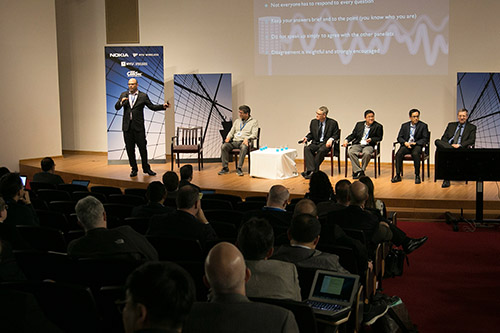
 Elza Erkip Receives 2026 Aaron D. Wyner Distinguished Service Award
 Theodore Rappaport Elected to American Academy of Arts and Sciences
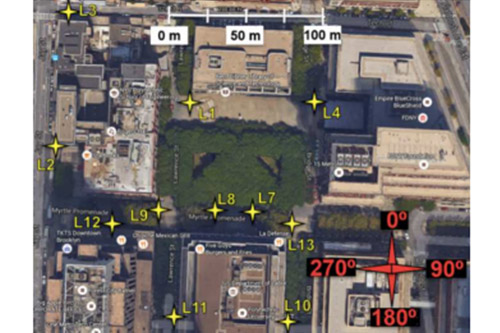

NYURay: A 3D Wireless Ray Tracer for Site-Specific Channel Prediction
NYU Wireless P.I.s
Research Overview
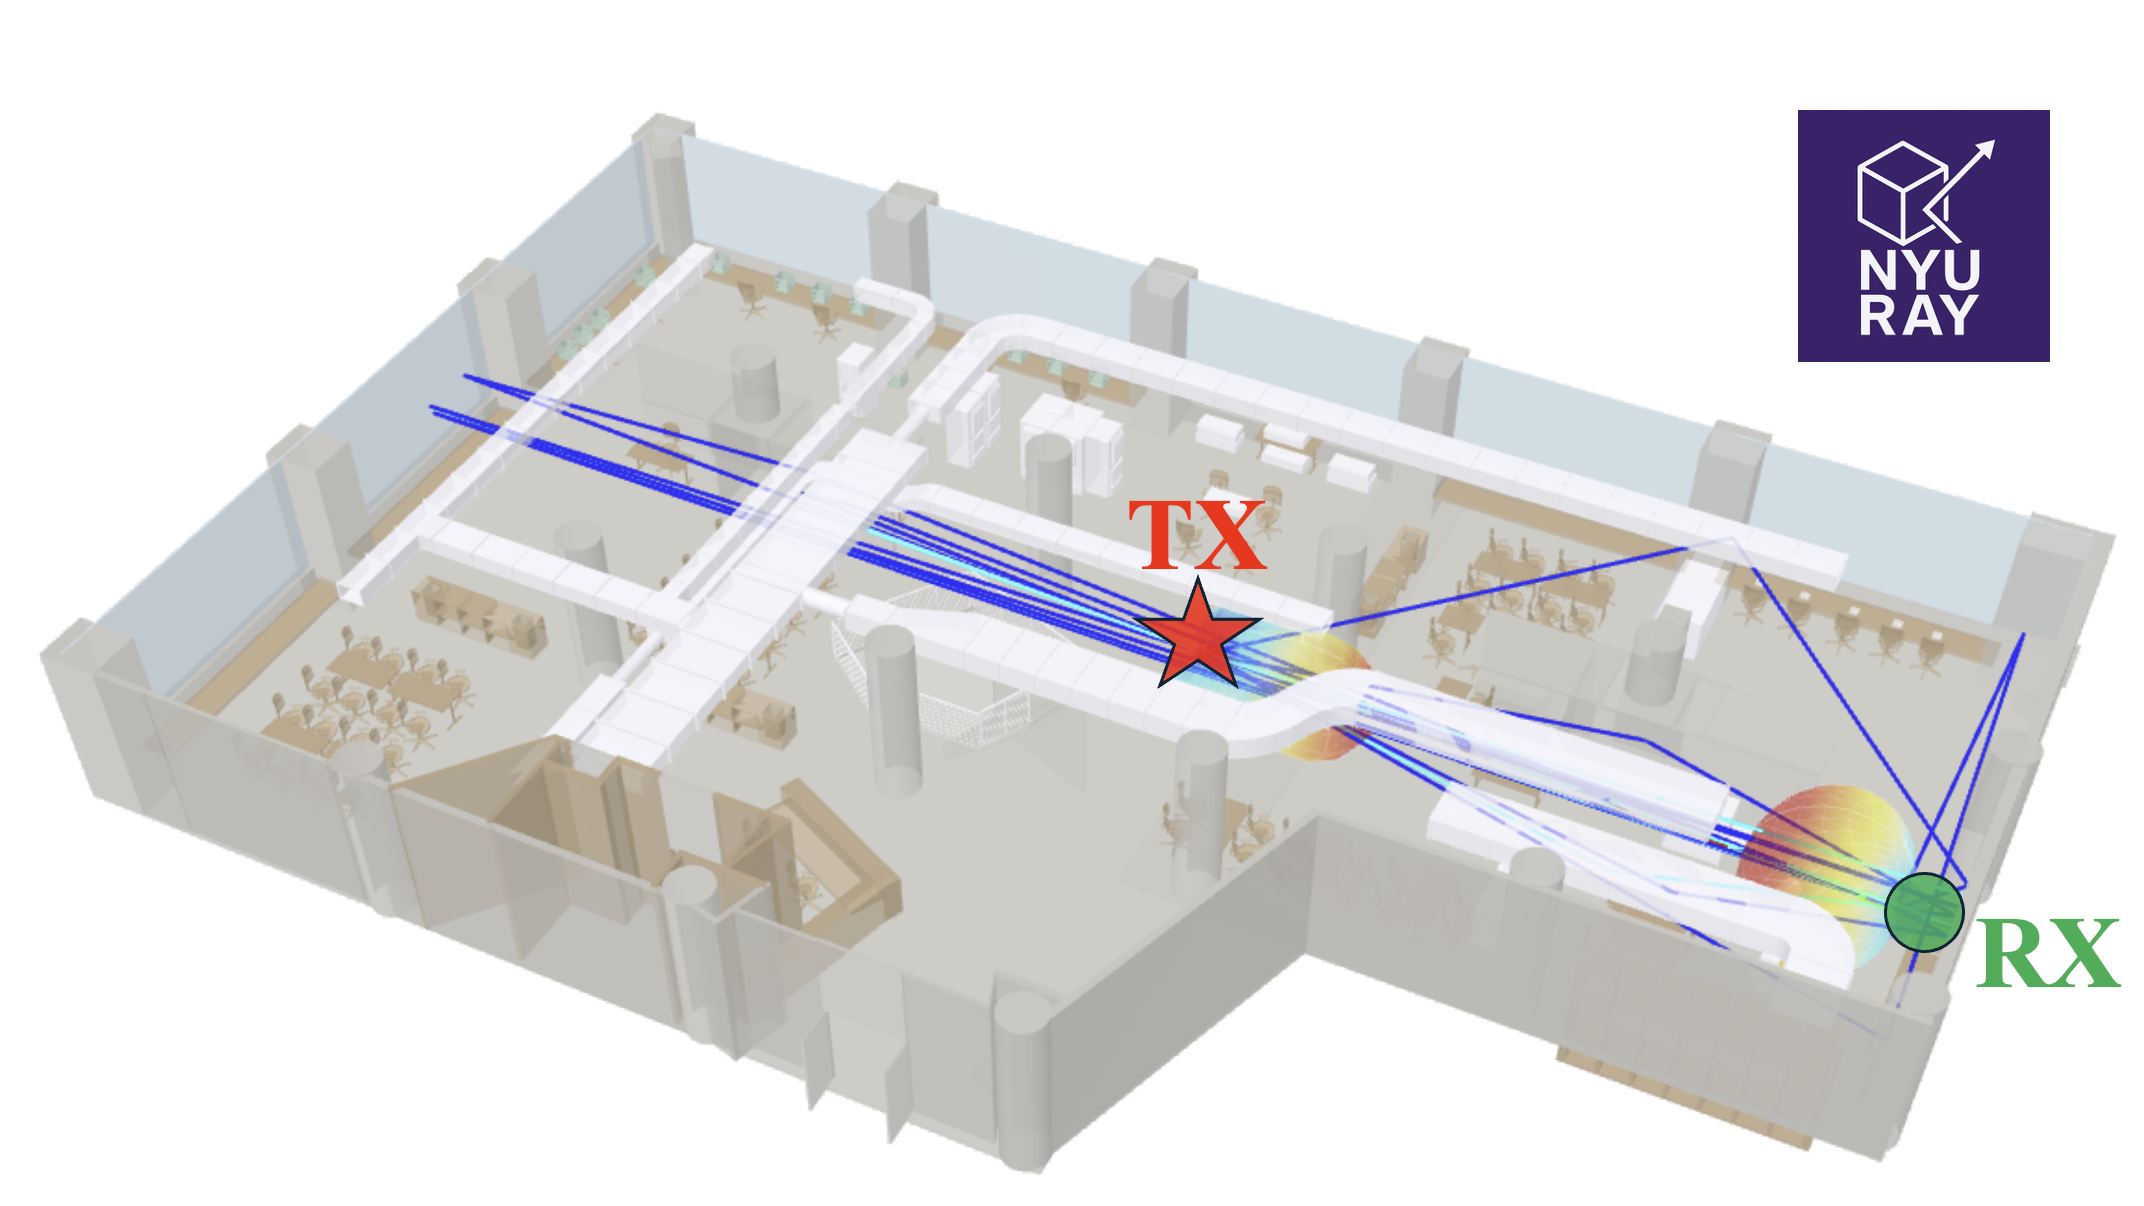
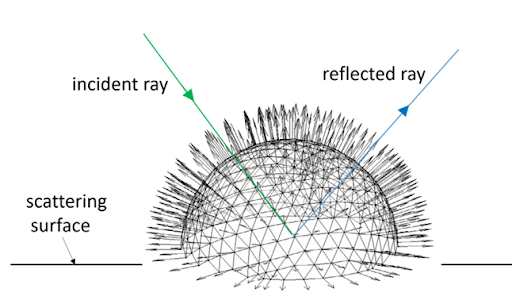
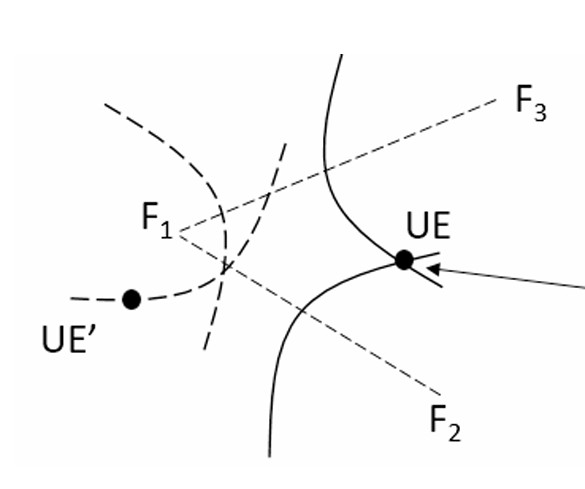
Fig. The signal path generated by the NYURay [1], [3], [4]
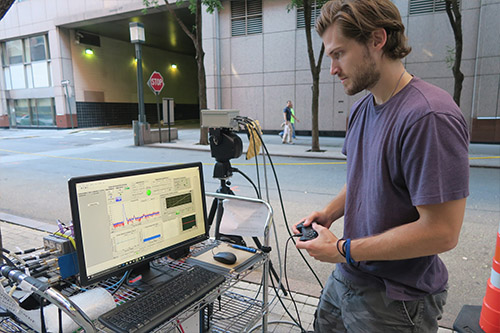
Ray tracing (RT) is a deterministic computational method used to model and predict the propagation characteristics of wireless signals in complex environments. The development of NYURay, an in-house three-dimensional wireless ray tracer supported by the NYU WIRELESS Industrial Affiliate Program and the National Science Foundation, originated from the early work of Ojas Kanhere [2], [3], [4]. His research established the foundation for accurate site-specific propagation modeling at millimeter-wave (mmWave) and sub-terahertz (sub-THz) frequencies through systematic validation with measured data.
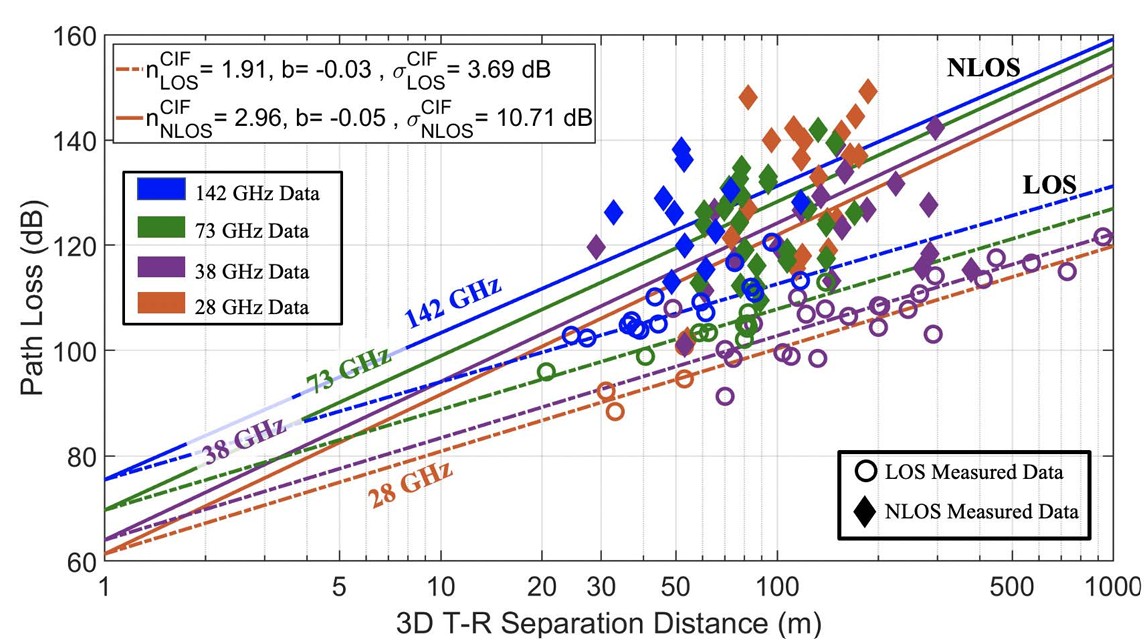
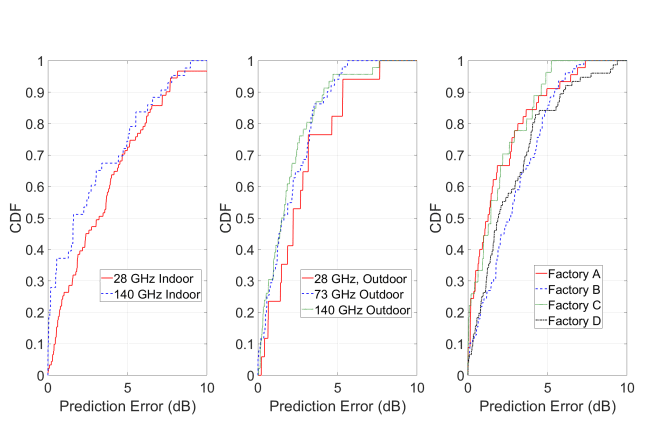
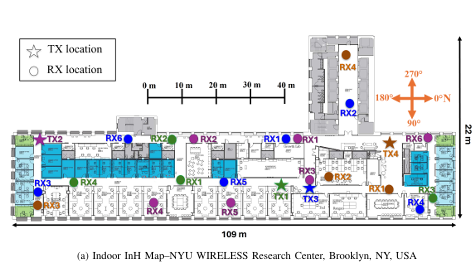
The current generation of NYURay advances this foundation through enhanced geometric accuracy, refined electromagnetic material modeling, and improved computational scalability. The model has been systematically calibrated using over a decade of directional channel measurements conducted at 28, 73, and 142 GHz in indoor, outdoor, and industrial environments [3], [5], [6]. NYURay predicts directional signal strength by simulating ray interactions with complex three-dimensional environments and reproduces realistic multipath characteristics across frequency bands and scenarios.
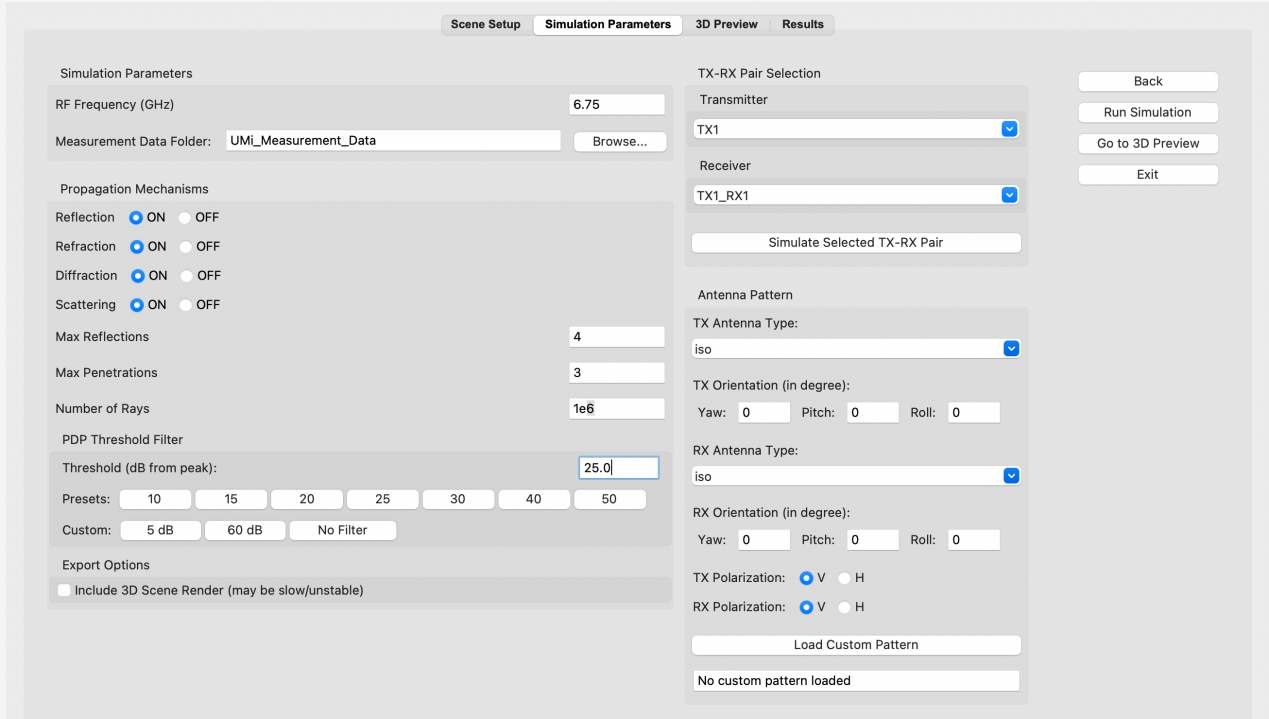
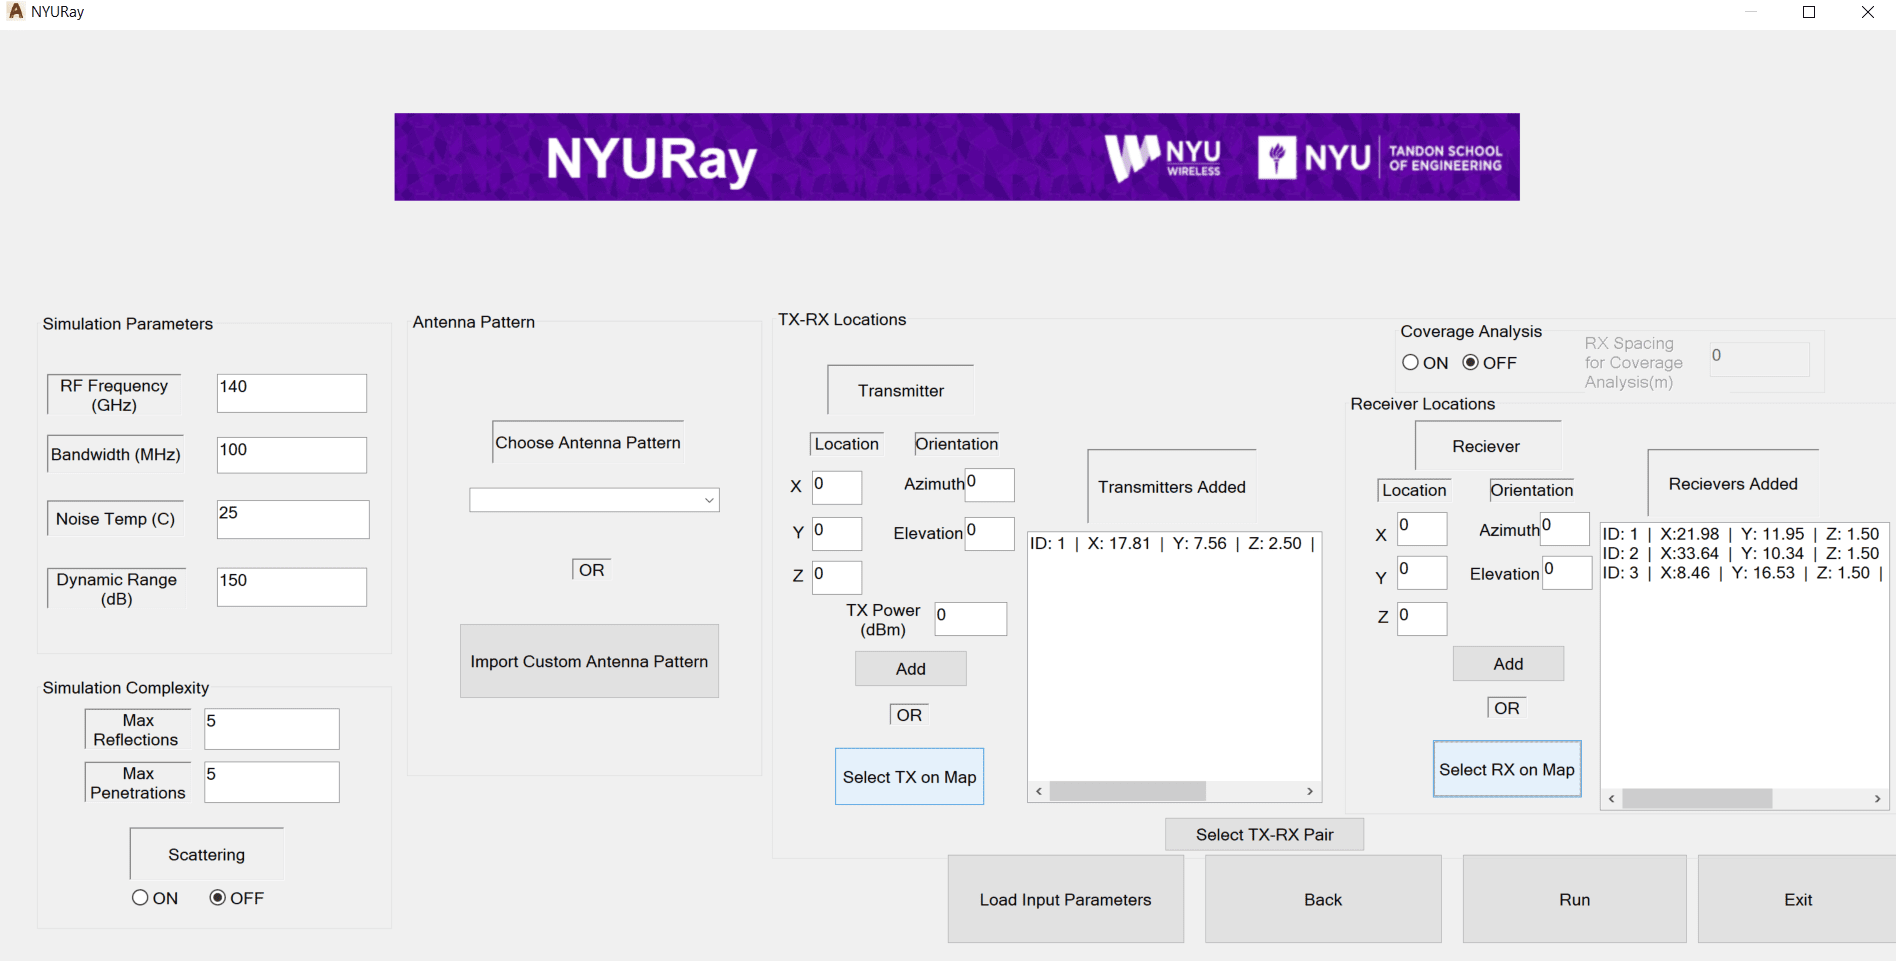
Fig. The GUI interface of NYURay (Enter Simulation Parameters) [13], [15]
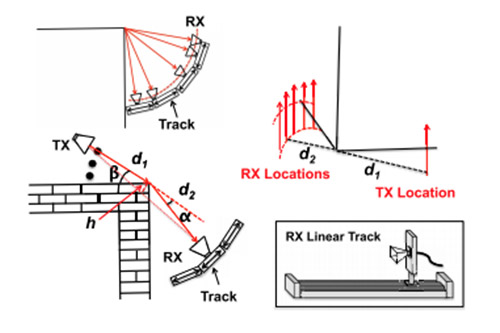
Ray tracing computations in NYURay are implemented through a hybrid algorithm that integrates the shooting and bouncing rays (SBR) technique with the image-based method. The SBR process first determines the approximate trajectories of rays that reach the receiver (RX) by tracing possible propagation paths through reflection and transmission. Once the sequence of interacting surfaces is established, the image-based method recursively computes reflections by constructing receiver images that accurately define each propagation path [1]. The hybrid algorithm achieves high computational efficiency while maintaining physical accuracy in modeling multipath propagation.
Current research focuses on integrating advanced computer vision and material recognition techniques for automated indoor three-dimensional reconstruction dedicated to wireless ray tracing. The objective is to streamline the creation of accurate and material-aware environmental models for ray tracing simulations, enabling rapid and efficient generation of RT-compatible scenes from visual data while preserving the accuracy required for channel prediction and electromagnetic analysis.
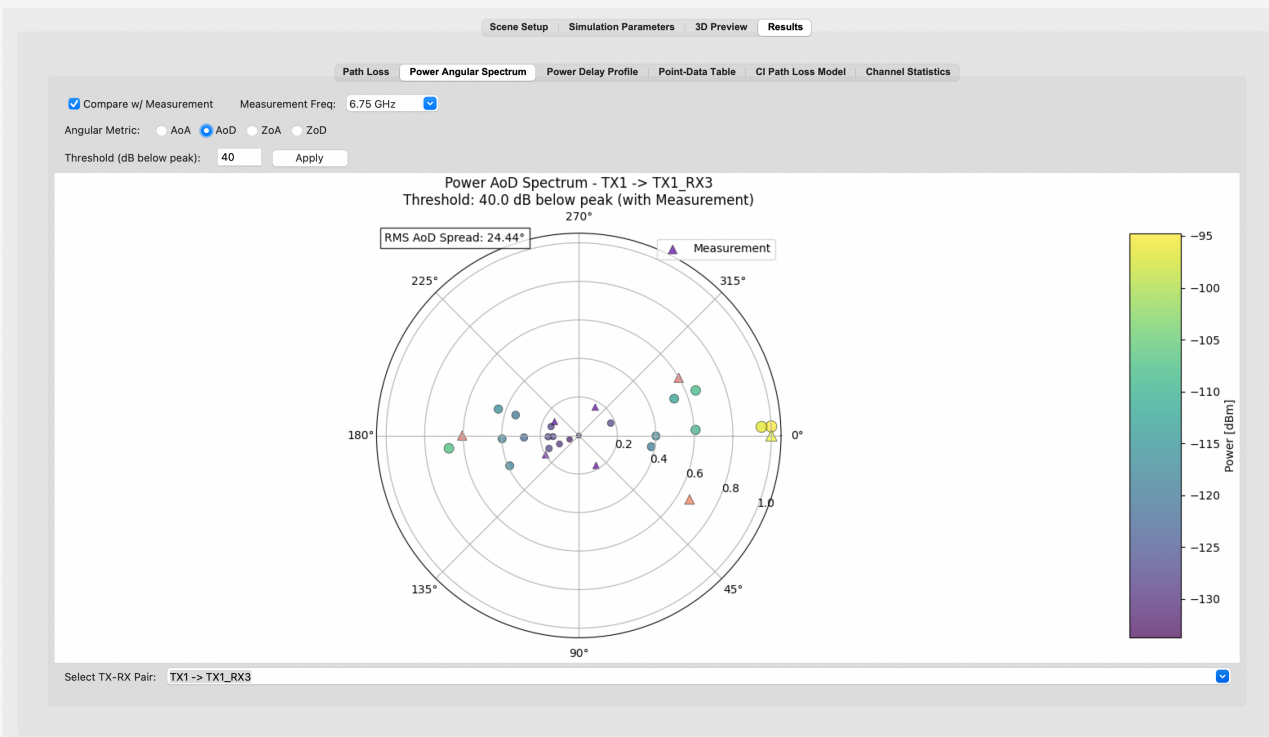
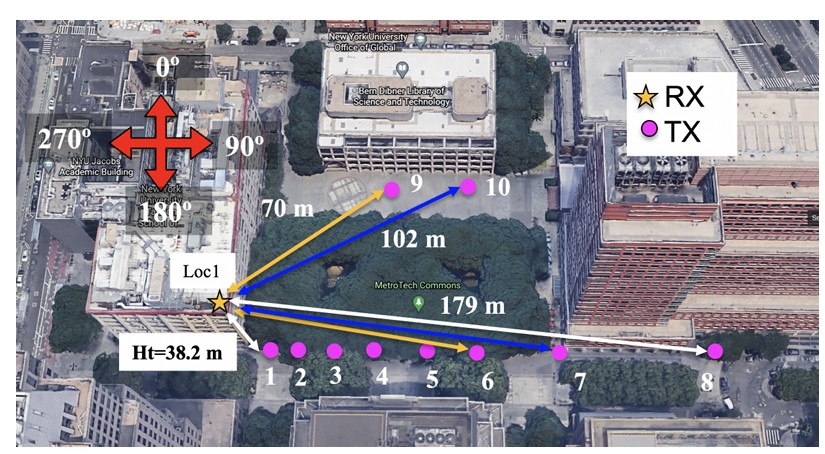
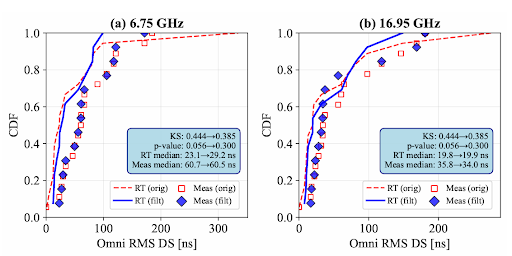
Fig. Power angular spectrum for selected TX- RX location pair (visualize the measurement vs ray tracing results).[14],[15]
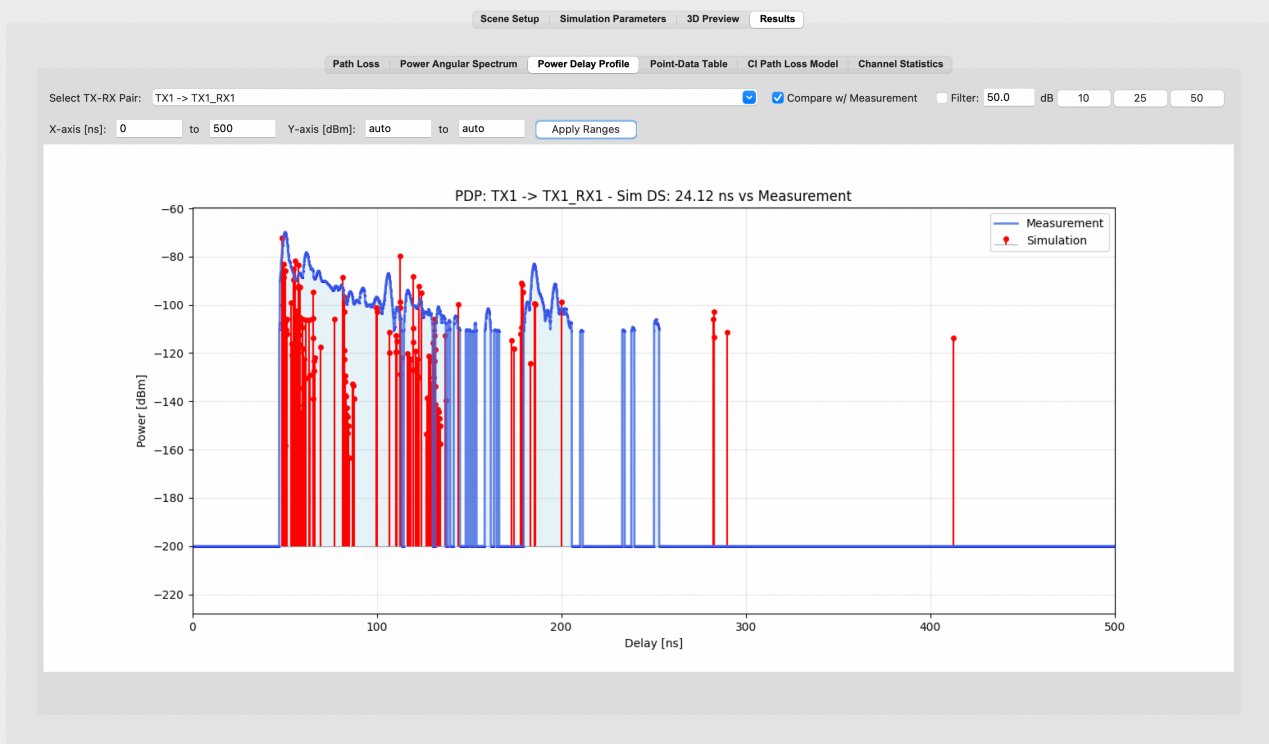
Fig. Comparison between the measured and simulated PDP obtained at an indoor factory location
at 6.75 GHz after calibration. [14],[15]
Key Features:
Simulation Configuration:
– User-specified RF parameters: frequency, bandwidth
– Configurable reflections, penetrations, diffraction, and scattering
– Antenna patterns: isotropic, dipole, 3GPP TR 38.901 antenna array, horn antenna, custom patterns
– Customized 3D environmental models via XML scene files
– Flexible TX/RX placement with 3D coordinate-based definitions
Material & Environment Modeling:
– Built-in database of electrical properties for building materials (0-100 GHz)
– Support for custom material property definitions
Advanced 3D Visualization:
– Fast Interactive Viewer: Lightweight HTML-based 3D preview
– Path Rendering: Real-time visualization of propagation paths as 3D lines
– Interactive Controls: zoom/rotate, toggle paths/devices visibility
Measurement Validation & Comparison:
– Power Delay Profile (PDP) comparison: Overlay measured vs. RT simulated data
– Power Angular Spectrum (PAS) analysis: Compare azimuth and elevation AOA/AOD
– Multi-frequency measurement support
– Threshold-based filtering for noise reduction
Channel Statistics & Metrics:
– Path loss vs. distance analysis
– RMS delay spread computation
– RMS Azimuth/Zenith spread of arrival (ASA/ZSA)
Data Export & Results:
– CSV export of simulation summaries (all metrics per TX-RX pair)
– Automated figure generation (PNG): path loss, PDP, PAS plots
– Measurement data integration and comparison reports
– Point data table export for simulated TX-RX location pairs
Related Publications
GLOBECOM 2025- 2025 IEEE Global Communications Conference, Taipei, Taiwan, Dec. 2025, pp. 1-6.
[2] ISAC Imaging by Channel State Information using Ray Tracing for Next Generation 6G
IEEE Journal of Selected Topics in Electromagnetics, Antennas and Propagation, vol. 1, no. 1, pp. 135-149, Sept. 2025, doi: 10.1109/JSTEAP.2025.360587
IEEE Transactions on Antennas and Propagation, vol. 73, no. 1, pp. 405-420, Jan. 2025, doi: 10.1109/TAP.2024.3472214.
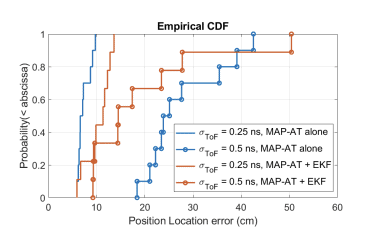
[4] Position Locationing for Millimeter Wave Systems
IEEE Global Communications Conference (GLOBECOM), Abu Dhabi, United Arab Emirates, 2018, pp. 206-212, doi: 10.1109/GLOCOM.2018.8647983.
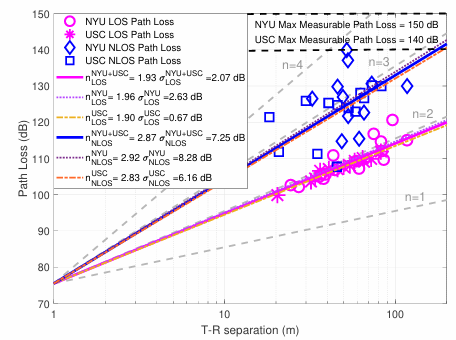
[5] Millimeter Wave and Terahertz Urban Microcell Propagation Measurements and Models
IEEE Communications Letters, vol. 25, no. 12, pp. 3755-3759, Dec. 2021, doi: 10.1109/LCOMM.2021.3117900.
[6] Propagation Measurements and Path Loss Models for sub-THz in Urban Microcells
ICC 2021 - IEEE International Conference on Communications, Montreal, QC, Canada, 2021, pp. 1-6, doi: 10.1109/ICC42927.2021.9500385.

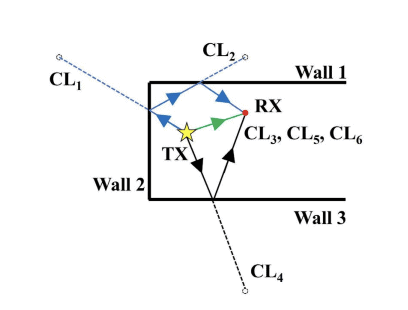
[7] Millimeter Wave and sub-THz Position Location and Ray Tracing
Ph.D. Thesis, NYU WIRELESS, NYU Tandon School of Engineering, Sept. 2022.
ICC 2023 - 2023 IEEE International Conference on Communications, Rome, Italy, 2023, pp. 5054-5059, doi: 10.1109/ICC45041.2023.10279044
[9] Outdoor sub-THz Position Location and Tracking using Field Measurements at 142 GHz
ICC 2021 - IEEE International Conference on Communications, Montreal, QC, Canada, 2021, pp. 1-6.
[10] Map-Assisted Millimeter Wave Localization for Accurate Position Location
2019 IEEE Global Communications Conference (GLOBECOM), Waikoloa, HI, USA, 2019, pp. 1-6
(invited) IEEE MILCOM 2025, Los Angeles, CA, USA, 2025, pp. 232-237, doi: 10.1109/MILCOM64451.2025.11309979.
IEEE International Conference on Communications (ICC), Montreal, QC, Canada, 2025, pp. 3285-3290, doi: 10.1109/ICC52391.2025.11161652.
NYU WIRELESS Technical Report, TR 2025-01, Apr., 2025
npj Wireless Technology (Invited), pp. 1--18, Mar, 2026. doi: https://doi.org/10.1038/s44459-025-00014-x
Master's Thesis, NYU WIRELESS, NYU Tandon School of Engineering, Apr. 2025